
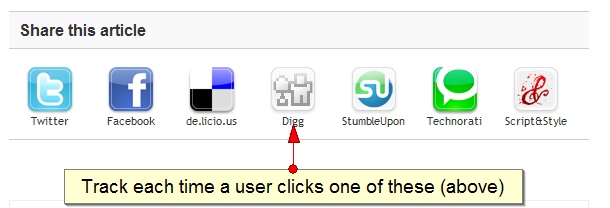
Recently, we wanted to improve our own goal tracking (on THATAgency.com) and wanted to share some of the details of how we did it. First (as always), let's start with our main goal: To gain visibility of 1) the total number of blog article 'shares' and 2) which articles are shared the most frequently. We define a 'Share' like this: A user who clicks one of the large social media sharing icons at the bottom of each post. See Below:
One way to track a click as a goal is to use JavaScript Event tracking with Google Analytics. What this basically does is 'trick' Google Analytics into tracking a pageview each time someone clicks any link that you tell it to. You'll want to track a pageview like this so that a goal can be setup (in Google Analystics) to record each time that 'fake pageview' happens. In our example above, we've amended each share link with the following:
onclick="javascript: pageTracker._trackPageview('/share/design-studio-blog/
2011/04/no-one-is-knocking-no-visitors-for-40-percent-of-uk-websites/');"
Within this link of code, we've included the 'fake' url which we'd like Google to track as a pageview. 2 important things to note:
Learn more about setting up JS events here.
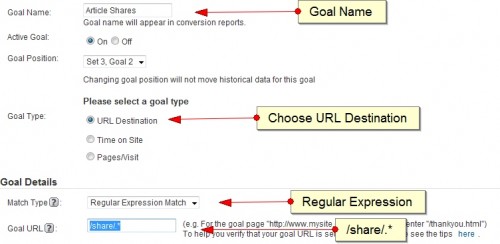
Now, we're going to go into Google Analytics to accomplish the first part of our goal: Tracking how many total shares do we get.
Now that all our article 'shares' are tracking to a single goal, we can run a gauntlet of reports in Google Analytics which will show us the relationship between traffic sources, landing pages, users, etc. and our goal accomplishments. But next, we wanted to see which of our articles were share the most often. For this, we create a simple Google Analytics custom report.
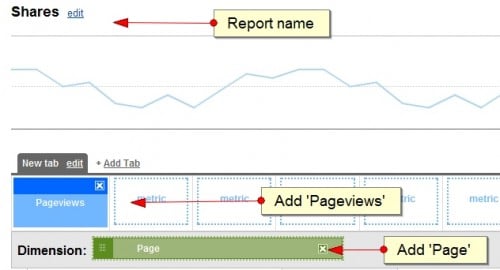
Lastly, we're going to customize this report to show the most frequent article 'shares' on your dashboard.
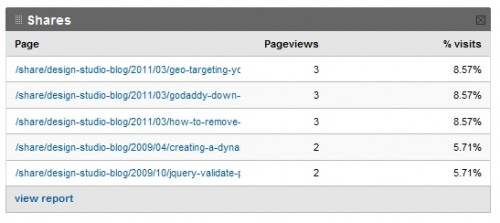
Alas, we've been able to setup a set of goals that are important to our business decision making. We can now track how effective our blog is as a whole (how often do people share our content with each other) and also which of our blog posts are the most effective (which ones are the most viral so we can write more like them!) Now please, share this article with your friends so we can track it!
Tags: SEO, Web Development, General

What Is Organic Traffic? (Complete Beginner Guide)
What Is Conversion Rate Optimization? (CRO Basics Explained)
What Is Engagement Rate? (Marketing Metric Explained)

How to Appear in ChatGPT Answers: Understanding AI Citation Signals

AI-Generated SEO Content at Scale: Why Output Without Strategy Damages Authority

700 S. Rosemary Ave.
Suite 204-707
West Palm Beach, FL 33401
P: 561.832.6262
F: 561.832.7707


